
Course and Journey Analytics are essential tools that allow for comprehensive tracking and reporting of employee engagement in your courses and journeys. These analytics are presented in an easy-to-understand and exportable format.
Feature Breakdown
💡 All content Creators and Co-Creators can view Analytics
Summary View
The Summary View offers a general overview of your learners' progress status. This provides a snapshot of how your Course or Journey is progressing, giving you the chance to monitor learners' work effectively.
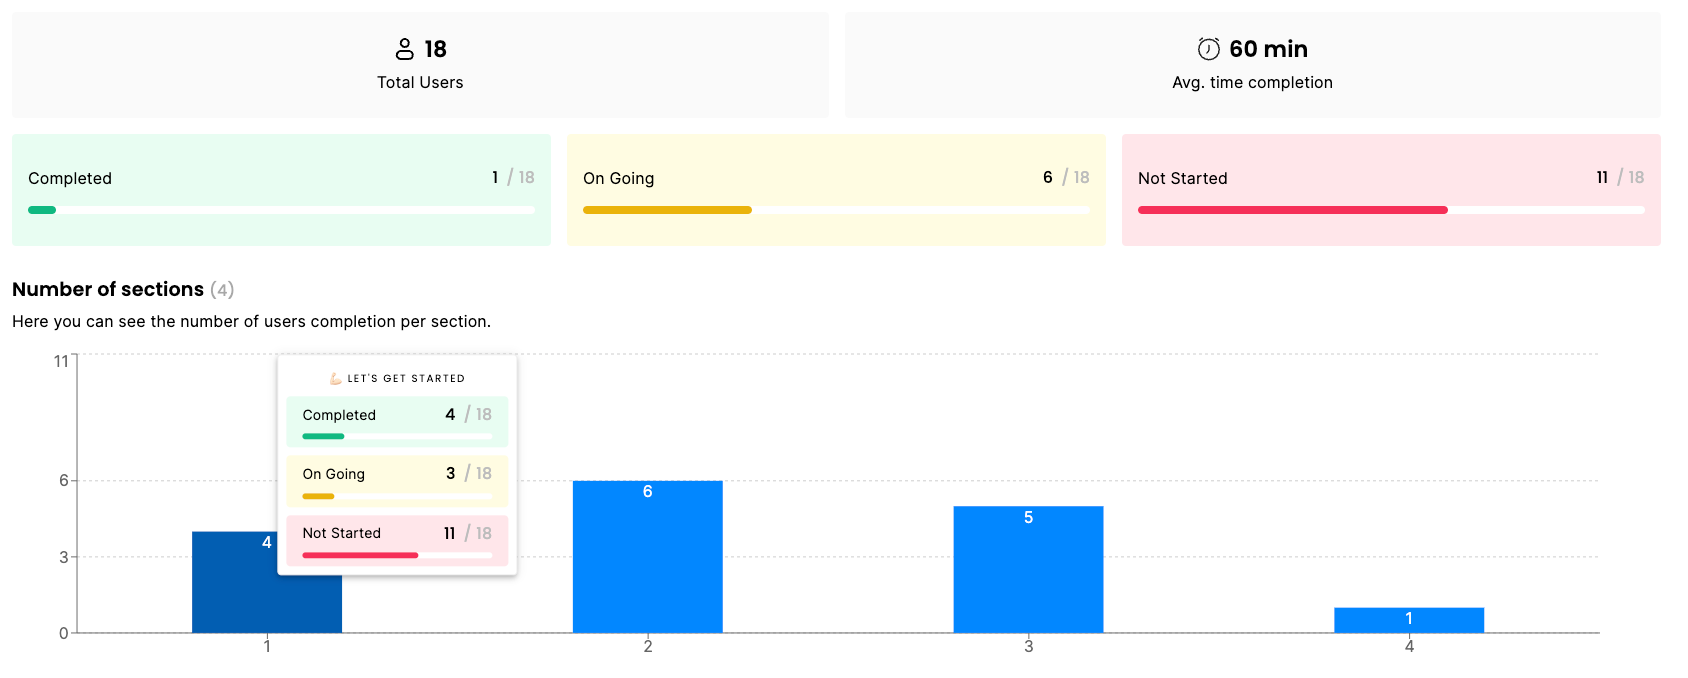
At the bottom of the Summary tab, you'll find a list of learners with general progress information. Clicking on a learner's name opens a detailed section, offering an accordion table of their learning experience, allowing for an in-depth view of each learner’s progress.

Step/Section View
The Section View allows you to delve deeper into the Course or Journey structure, showing the completion rates per section.
Overview and Selected tabs
'Overview' provides a general view of all steps with progression status in numbers, while 'Selected' offers detailed information per step for each user. This includes progress status, completion date, last activity, and more. In 'Selected' mode, you can navigate between steps using arrows.

Responses View
The Responses View gives you a detailed analysis of Quizzes and individual questions within your Course or Journey. It allows you to review, grade, and analyze your Quizzes and questions.
Overview and Selected tabs
The 'Overview' tab provides a holistic view of question statuses, allowing you to see a broad perspective of the responses across your Course or Journey. Clicking on a specific question directs you to detailed information in the 'Selected' tab.
The 'Selected' mode offers detailed information for a specific question, including user responses and assessment options, once you click on it. This functionality is similar to the Sections/Steps Tab, providing a comprehensive and detailed insight into learner responses and engagements.

When you select a question, a chart shows up displaying the total responses per answer option, giving a quick glance at response distribution.
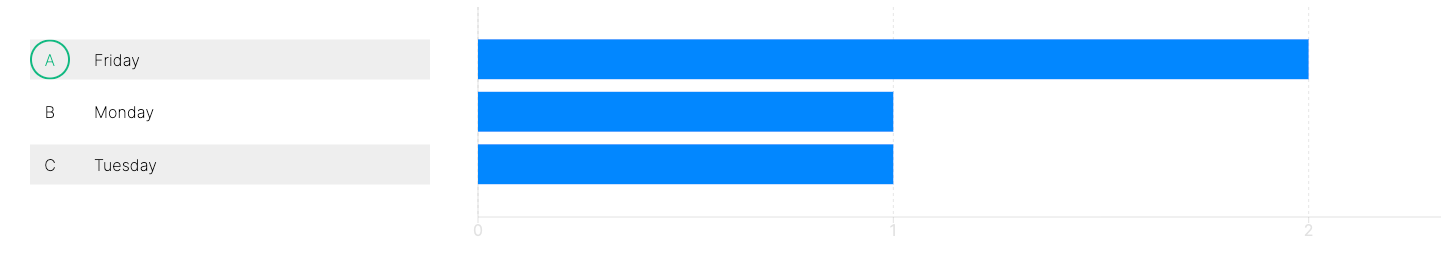
Right beneath the chart, you'll find a list of all employees who participated, paired with their particular answers.

For any Open Question, File Question, or Recorded Question, there's an option enabling you to grade the responses.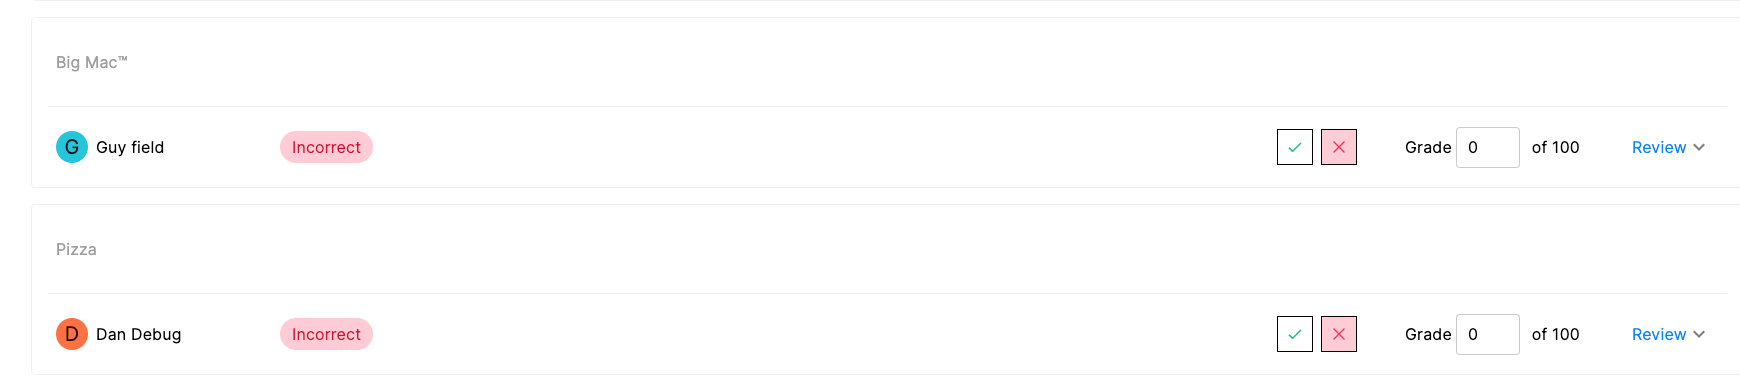
Customizable Filtering
One of the key features of our Course and Journey analytics is the ability to filter data based on various user attributes. Creators can filter the views using different attributes such as location, department, position, and more. This allows you to focus on specific data sets that are relevant to your analysis, enabling more targeted decision-making.
-gif.gif)
Signature View
The Signatures View is specifically designed to meet your compliance needs
Overview and Selected Tabs
This tab provides a comprehensive view of all signature requests, allowing you to see a broad overview across your Course or Journey.

In the 'Selected' mode, you can access detailed information for specific signatures.

Navigating to Course or Journey Analytics
- Course Analytics is conveniently located at the top right corner of the screen:

- To find the Journey Analytics, head over to "Manager Panel" → "Analytics":
-gif.gif)
Need More Information or Help?
For additional information or assistance with these features, please don't hesitate to contact us at support@junojourney.com. Our support team is ready to provide you with the help you need to make the most of your Juno Journey experience.