
This report quantifies user engagement with internal content. It provides metrics like participation rates and completion percentages to gauge the effectiveness of your internal learning initiatives.
Table of Contents
- What is the Purpose of This Report?
- Understanding the Report Generator
- Generating and Managing reports
- Other report types
What is the Purpose of This Report?
This report is your ultimate tool for content analytics. L&D teams and content creators can delve into how each piece of content—be it a course, a quiz, or a journey—is faring in terms of user engagement. The insights from this report will guide you in fine-tuning your content strategy.
Understanding the Report Generator
To get the most accurate Internal Learning Activities Report, here are a few things you should get to know:
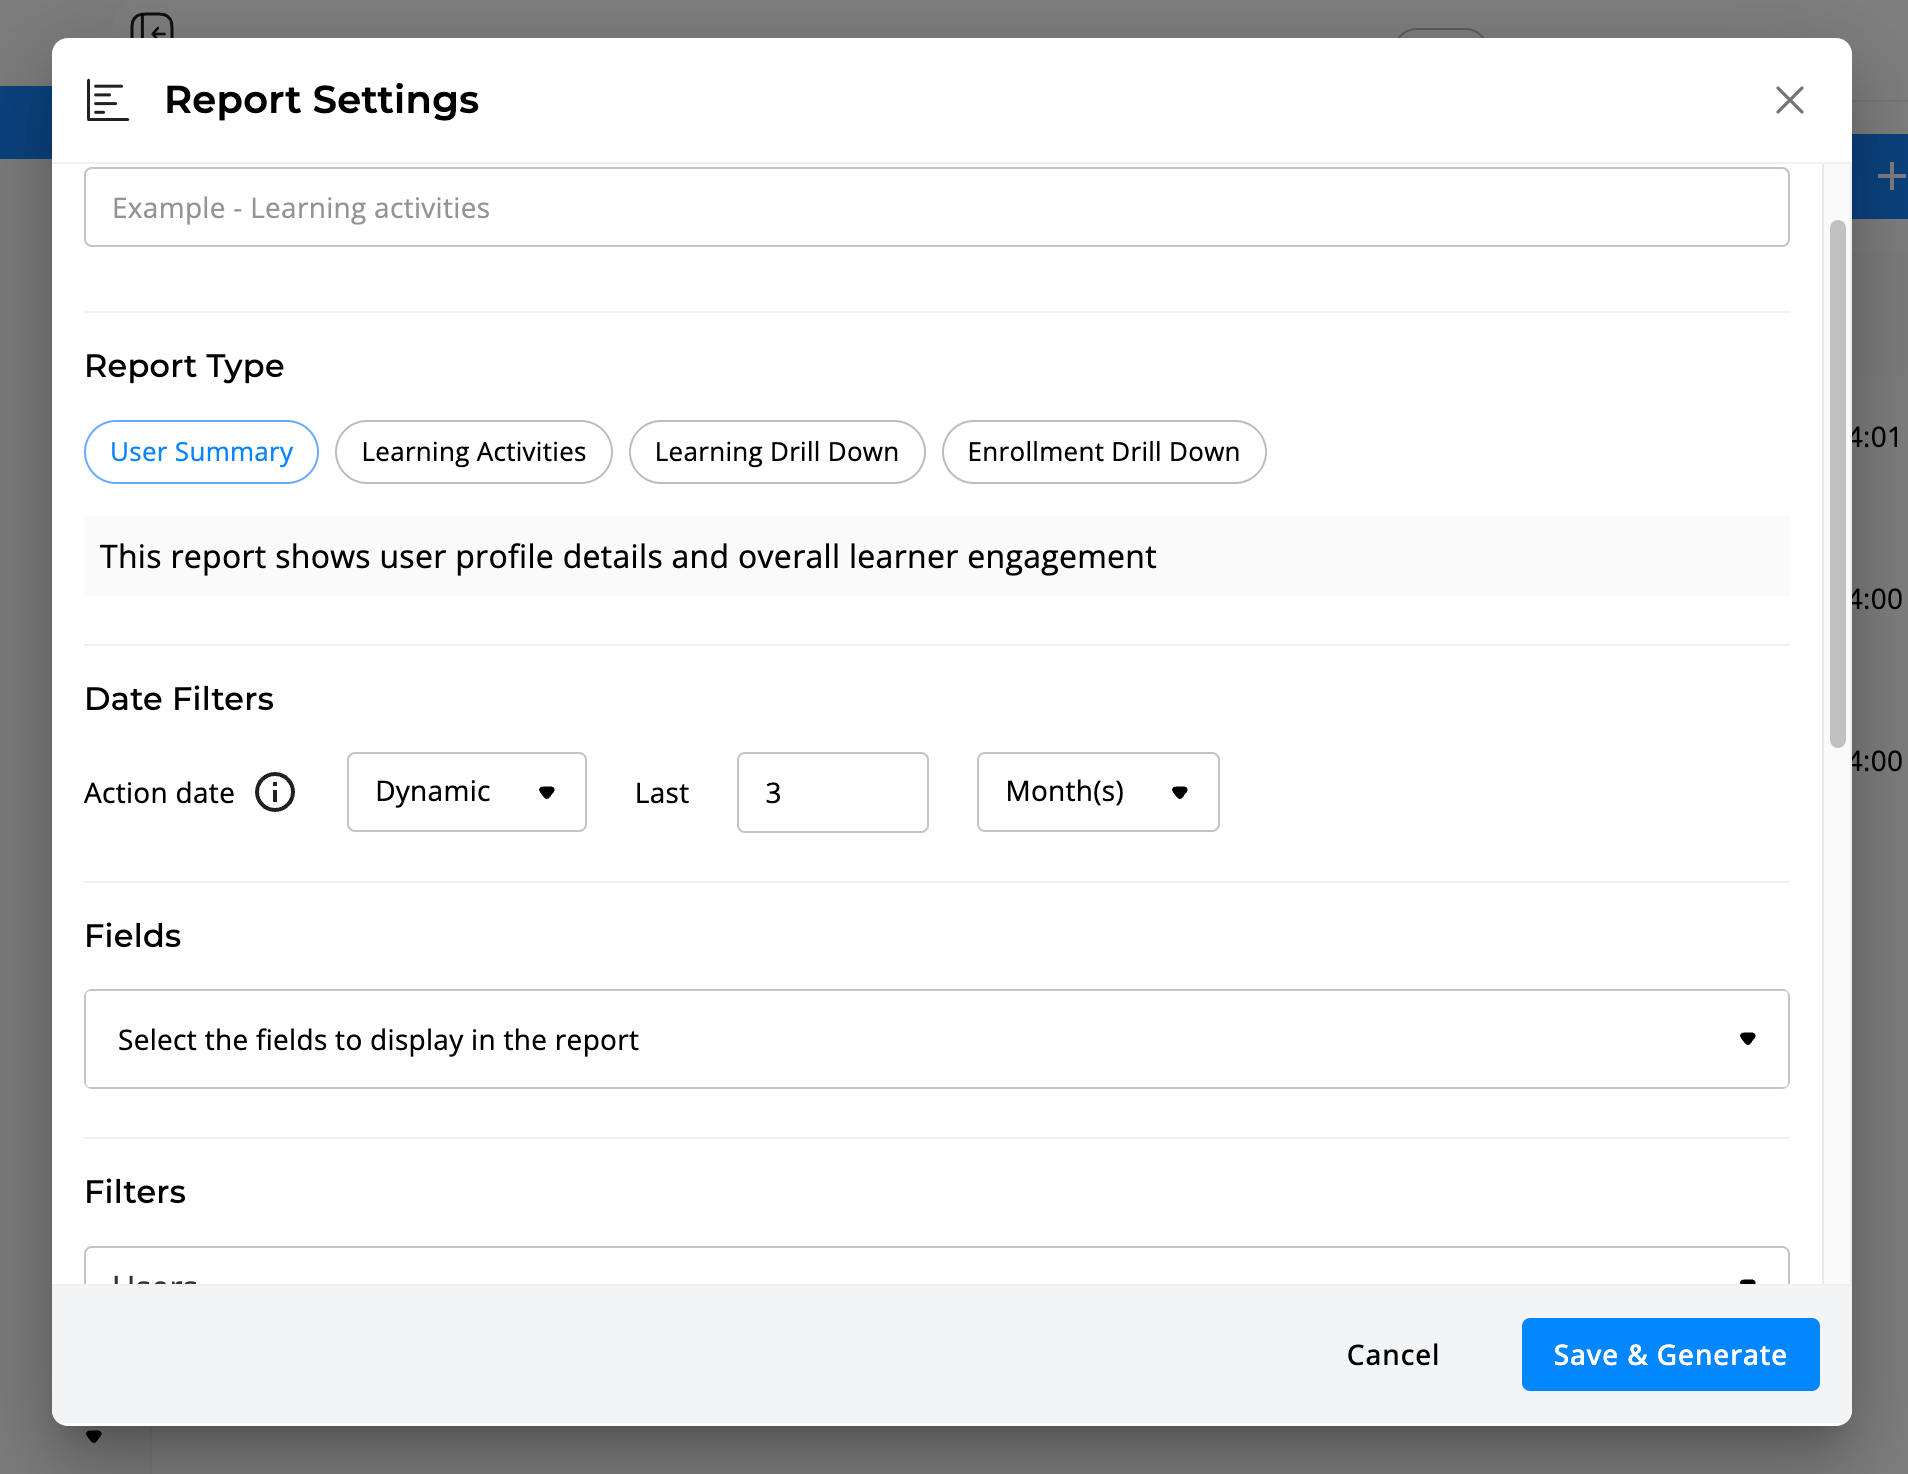
How to Use Date Filters
Action Date
Specify a date range to view learning activities that users engaged with during that period:
- For Internal Content - Captures employee engagement, showing interactions that have taken place within the defined date range.
- For Events - The report reflects Event participation if it falls within the selected date range.
-gif.gif)
- Static - Fixed criteria; doesn't change unless manually updated.
- Dynamic - Automatically updates based on predefined conditions.
💡 Note that the available data for this report begins on January 1st, 2023,
💡 This report captures employee content engagement during the selected time period
Selecting the Appropriate Fields
The fields you select will become the columns in your exported data file. Choose fields that align with your reporting needs to make data analysis easier. Here's a breakdown:
Learning Metrics
- Learning Activity Title: The name assigned to each learning activity, be it a Course, Quiz, Journey, etc.
- Content-Type: Identifies what kind of learning material it is—like a Course, Journey, Event, etc.
- Last Updated: The most recent date when changes were made to the content.
- Editor: The names of the content owners and co-editors
- Published to Company Academy: Indicates whether the content is available to the entire organization.
- Creation Date: The date when the learning material was originally created.
Time Metrics
- Average Time to Complete (Minutes): For a Course, Journey, Quiz, SCORM - The average number of minutes users take to finish the learning activity.
- Duration (Minutes): For Events - This is the total length of time set by the event's organizer. If there are multiple sessions, it shows the combined time for all.
- Number of Learners Started: Counts how many users have begun the learning activity.
- Number of Learners Completed: For Courses, Journeys, and other learning content, this is how many users have finished. For Events, it's the number of attendees.
-gif-1.gif)
💡 The employees' progress data shows information as of the date the report was generated
Applying Filters
Filters narrow down the data for targeted insights. Available filters include:
- Internal Learning Activity: Manually choose specific content pieces.
- Username: By individual user or users.
- Department: Filter by organizational departments.
- Location: By geographical or office location.
- Group: By teams or project groups.
- Content Type: By learning material type, such as Courses or SCORM.
- Hire Date: By employees' hire timeframe.
-gif-1.gif)
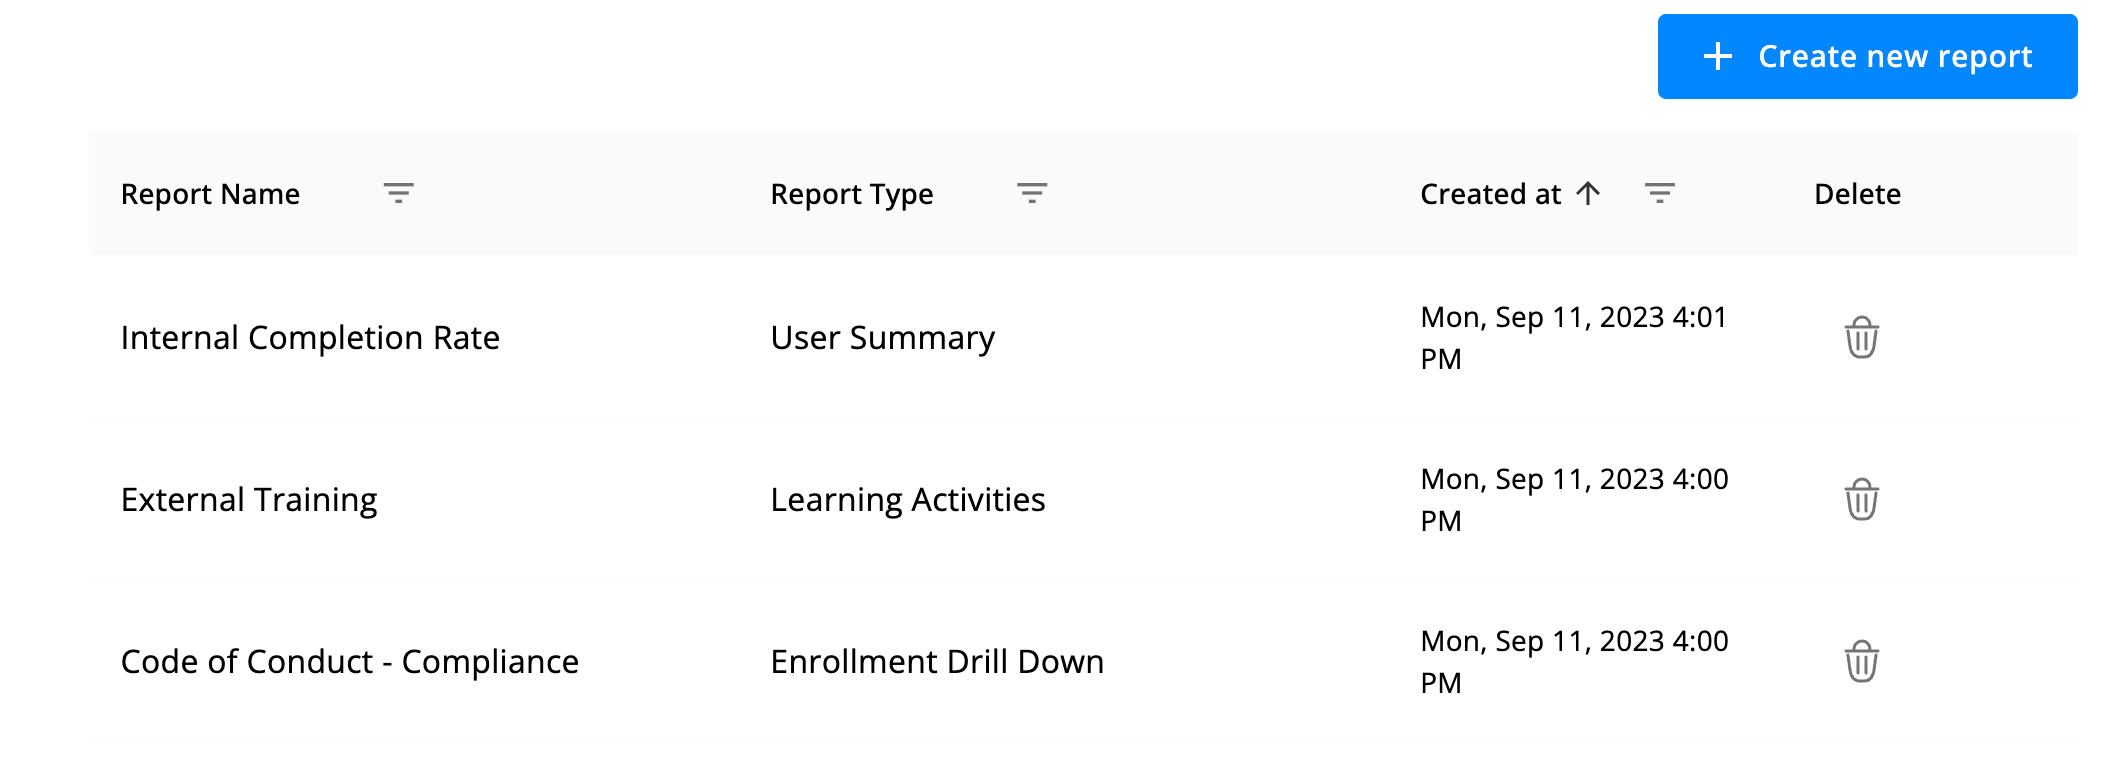
Generating and Managing reports
After you've customized your report, click the "Save & Generate" button to download it in Excel format.
The report will then be downloaded and saved to the reports table as a template for future use.
Need a different type of report?
Couldn't find what you're looking for in this report, or need a different kind of report? Click here to explore the other articles in this chapter that can guide you through our various reporting features.
❗️If you encounter any issues or have specific questions, feel free to contact our support team for assistance.