
This report offers granular insights into user progress for each learning activity, from course modules to quizzes. Use it to identify learning patterns, roadblocks, and areas for improvement.
Table of Contents
- What is the Purpose of This Report?
- Understanding the Report Generator
- Generating and Managing Reports
- Other report types
What is the Purpose of This Report?
Get granular with the Learning Drill Down Report. L&D teams can use this to pinpoint exactly where learners are excelling or struggling, making it easier to offer targeted coaching or additional resources. It's also a powerful tool for content creators who want to identify any potential areas of improvement in the learning materials.
Understanding the Report Generator
To get the most accurate Learning Drill Down Report, here are a few things you should get to know:
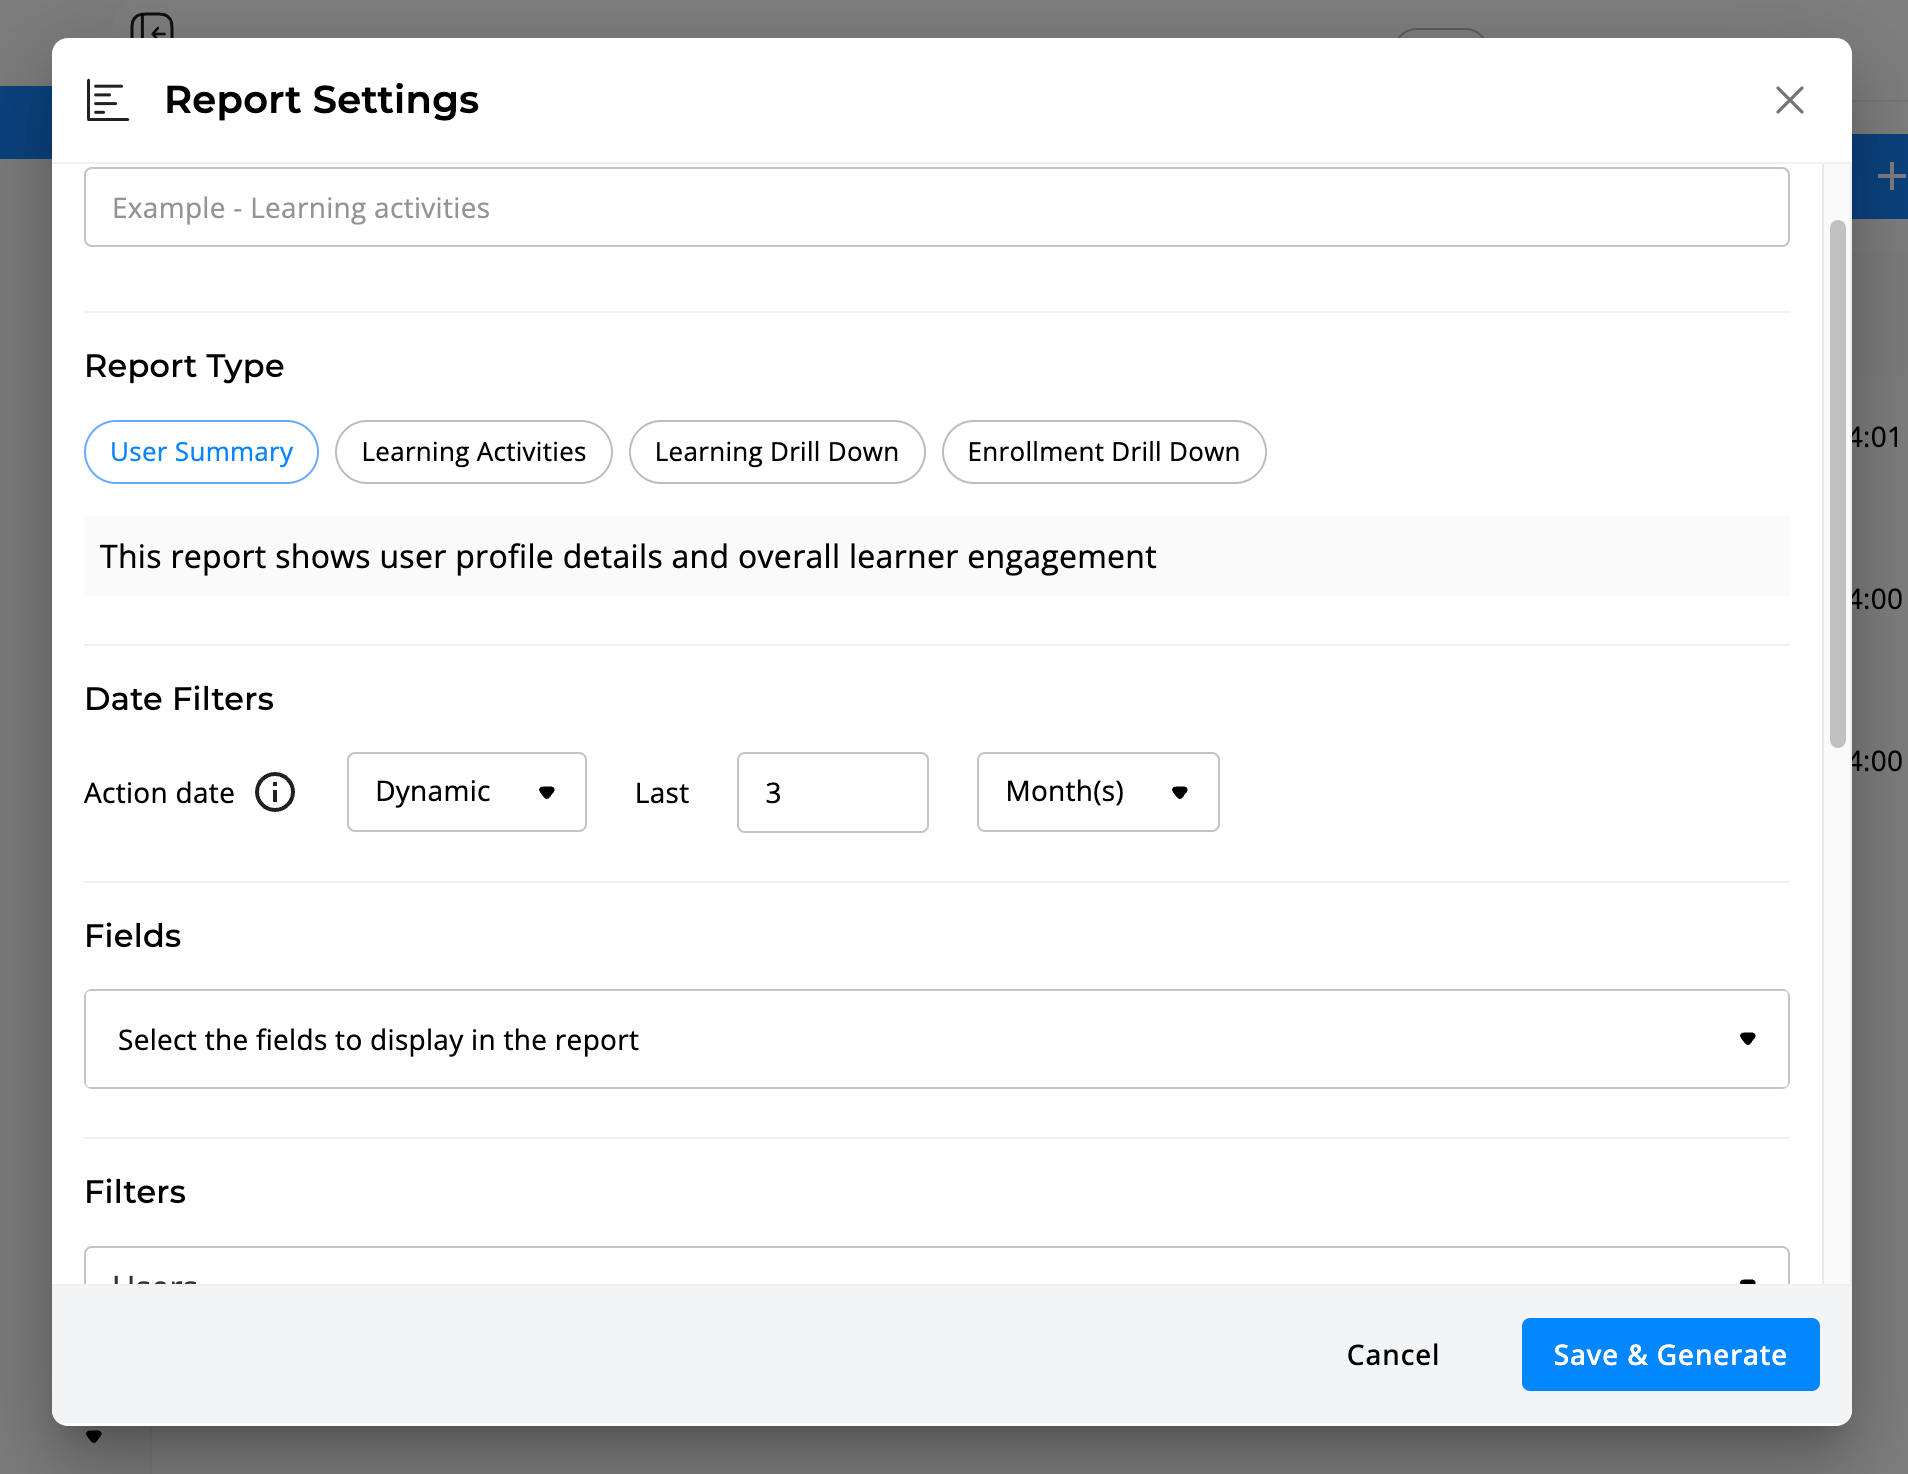
How to Use Date Filters
Action Date
Specify a date range to view learning activities that users engaged with during that period:
- For Internal Content - Captures employee engagement, showing interactions that have taken place within the defined date range.
- For Events - The report reflects Even participation if it falls within the selected date range.
- Paid External Courses - The report will capture any utilized budget for external content as long as the spending took place within the specified timeframe.
- Free External Course - The report will include any instances where the progress was manually updated by the employee to "Completed."
-gif.gif)
- Static - Fixed criteria; doesn't change unless manually updated.
- Dynamic - Automatically updates based on predefined conditions.
Tabs in the Generated Sheet
- Learning Activities: This tab lists each Learning Activity for every user, giving you a granular look at individual participation.
- Journey: This tab is dedicated to data that pertains exclusively to Journeys, offering insights into the Journey as a whole.
These tabs will appear as distinct sections in the generated sheet, making it easy to switch between various data categories.
💡 Note that the available data for this report begins on January 1st, 2023,
💡 This report captures employee content engagement during the selected time period. No engagement? No data :)
Fields Selection
The fields you select will become the columns in your exported data file. Choose fields that align with your reporting needs to make data analysis easier. Here's a breakdown:
Content Information
- Learning Activity Title: The specific name assigned to each learning step, such as a SCORM module or external course.
- Content Type: The category of learning material, like a Course, Event, SCORM, external course, or Custom Request.
- Parent Learning Item: If a Course is part of a Journey, this field will display the Journey's name. In the case of multiple Journeys, the values will be comma separated.
- Provider: The name of the content provider for both paid and free external courses and Custom Requests.
Time Metrics
- Time Spent: Amount of time an employee has engaged with internal content.
- Duration: For external content, this is the time provided by the content creator. For Events, it's the total time of all sessions.
- Start Date: The date the learning activity was initiated.
- End Date: The date the learning activity was completed.
- Action Date: Refers to the "Action Date" paragraph for more details.
Learner Engagement and Progress
- Progress Percentage: The completion rate for internal content.
- Progress Status: Indicates whether the learning activity is 'In Progress' or 'Completed'.
- Score: The score of the learning activity, in case it includes quiz elements.
Employee Info
- Username, Email, Role, Job Title, Department, Location, Hire Date, Direct Manager
-gif-1.gif)
Undertrstanding Filters
Filters narrow down the data for targeted insights. Available filters include:
- Internal Learning Activity: Manually choose specific content pieces.
- Username: By individual user or users.
- Department: Filter by organizational departments.
- Location: By geographical or office location.
- Group: By teams or project groups.
- Content Type: By learning material type, such as Courses or SCORM.
- Hire Date: By employees' hire timeframe.
-gif-1.gif)
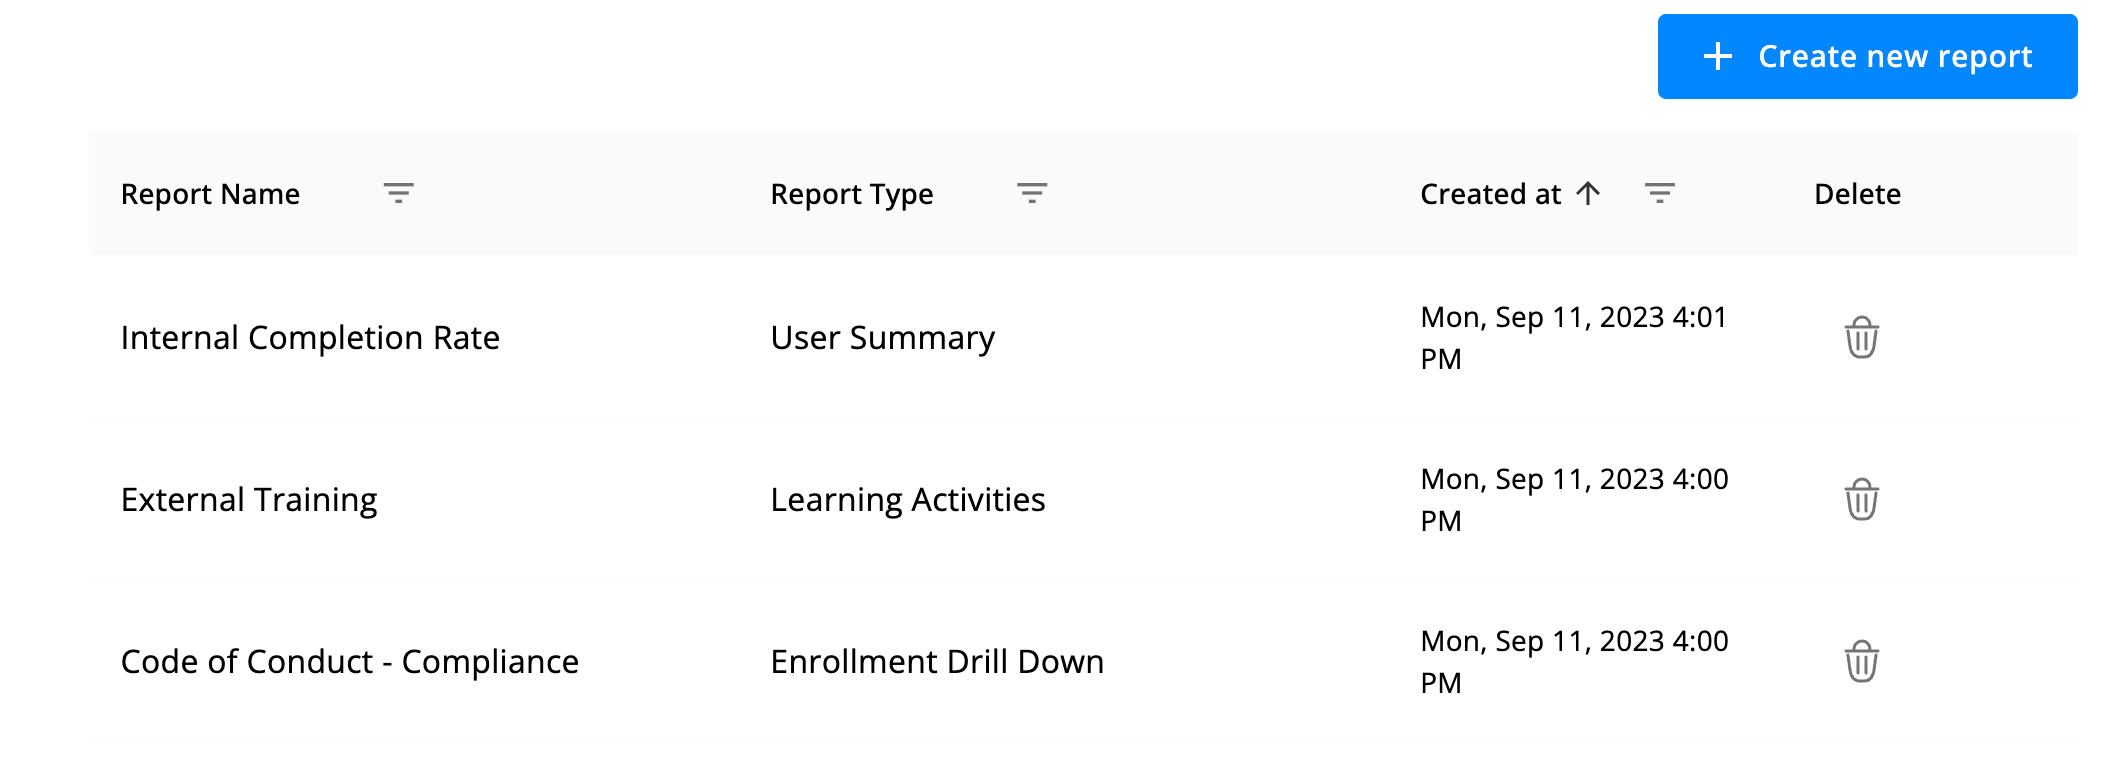
Generating and Managing reports
After you've customized your report, click the "Save & Generate" button to download it in Excel format.
The report will then be downloaded and saved to the reports table as a template for future use.
Need a different type of report?
Couldn't find what you're looking for in this report, or need a different kind of report? Click here to explore the other articles in this chapter that can guide you through our various reporting features.
❗️If you encounter any issues or have specific questions, feel free to contact our support team for assistance.